


Faculty & Research

Faculty & Research
AI Bubble: A Framework for Investors

By Prof. Mattia Landoni, Associate Professor of Finance, and Prof. Renxuan Wang, Assistant Professor of Finance, CEIBS
There has been growing concern about the possibility of an AI bubble. Google search interest for "AI bubble" (Exhibit 1) climbed markedly in 2025, and major outlets offered their own analyses, including the Financial Times, Wall Street Journal, The Economist, Brookings and The New York Times. Prominent investors such as Ray Dalio and Michael Burry, of The Big Short fame, have also expressed variants of the bearish case that AI-related firms are overpriced.
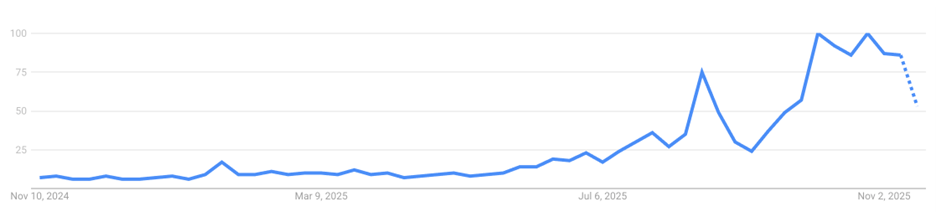
Exhibit 1. Google search interest in "AI bubble" over time
Google Trends: AI bubble search interest
Because the debate has produced a flood of data-driven analyses that frequently reach conflicting conclusions, we will endeavour to find a common thread within existing arguments and offer a framework through which new data can be interpreted.
A key distinction runs through the debate: the difference between investors pricing AI optimistically and firms investing in AI infrastructure optimistically. These are logically separate claims. As Warren Buffett famously put it, "a too-high purchase price for the stock of an excellent company can undo the effects of a subsequent decade of favorable business developments".
Why Market Timing Calls Keep Failing
Investors who anticipated a sharp correction in AI stocks have learned how difficult it is to get the timing right.
When this analysis was first published in November 2025, Ray Dalio had already been expressing concerns about elevated valuations for much of the year, even as markets continued to rally. Michael Burry's short positions in NVIDIA and Palantir had become public through delayed regulatory disclosures, by which time his fund had already been wound down. In closing the fund, he lamented that his "estimation of value" was "not in sync with the markets".
None of this discredits them as investors. Market timing is notoriously difficult; some say it is like catching a falling dagger. Even if you succeed, you may still get hurt.
Even those who are eventually proven right often suffer for being early. Michael Burry, famous for predicting the 2007 subprime collapse, endured deep mark-to-market losses before being vindicated. Julian Robertson correctly foresaw the technology bubble in the late 1990s but closed his fund just before it burst.
One of the authors of this piece learned the same lesson early. As a new high-school graduate, he invested what was then a personal fortune in a single internet stock, just in time for the Dot-com crash to erase almost all of it.
The difficulty of distinguishing an expensive market from one about to collapse is also evident in institutional research. Two influential reports published in London on the same day in October 2025 reached different conclusions. The Bank of England warned of elevated downside risk in equities, while Goldman Sachs International argued that the market was not yet in a bubble.
Events since the original publication offer another reminder that market corrections do not necessarily arrive in the way investors expect. By October 19, 2026, the Philadelphia Semiconductor Index had fallen approximately 24% from its June highs, entering bear-market territory. Yet the broader S&P 500 remained positive for the year, supported by gains beyond the semiconductor sector. The divergence suggests that concerns about AI spending can produce substantial losses in particular industries without necessarily triggering a comparable decline across the entire stock market.
Such developments are consistent with the difficulty of timing an investment thesis. They demonstrate that a bearish assessment can be relevant without correctly predicting when, where or how sharply valuations will adjust.
Are AI Stock Prices, or All Stock Prices, Too High?
Most observers agree that equity valuations have been elevated, including both technology and non-technology stocks.
In its October 2025 analysis, Goldman Sachs estimated that the long-run dividend growth implied by stock prices was implausibly high, but still below historical bubble extremes such as the Dot-com episode in 2000 or the "Nifty Fifty" era of the 1960s and early 1970s.
By this measure, valuations were elevated but not obviously irrational.
A more familiar metric, the price-to-earnings (P/E) ratio, helps put the assessment into perspective. According to FactSet's October 16, 2026 earnings update, the S&P 500 traded at a forward 12-month P/E ratio of 19.0, slightly below its five-year average of 19.8 and ten-year average of 19.1. That is a different picture from the P/E multiple of 20–25 discussed when the paper was originally published.
The longer-term valuation measure is less reassuring. The cyclically adjusted price-to-earnings ratio, or CAPE, compares stock prices with average inflation-adjusted earnings over the previous ten years. According to Multpl's historical CAPE data, the S&P 500 CAPE stood at 41.07 on October 1, 2026, compared with 39.16 in November 2025. This places valuations at historically elevated levels, although CAPE is more useful for assessing long-term return expectations than predicting the timing of market corrections.
Individual AI-related companies offer another perspective. NVIDIA's forward P/E ratio was approximately 18 on October 19, 2026, reflecting expectations for substantial future earnings. This differs from the speculative valuations associated with some leading technology stocks at the height of the Dot-com boom, including Cisco, whose shares commanded exceptionally high earnings multiples before the crash. The comparison should be treated cautiously because the companies operate different businesses and the figures refer to different market conditions.
Another important observation from the original analysis was that the S&P 500 excluding Big Tech traded at even more extreme multiples on some valuation measures. Other major equity markets showed similar patterns.
This suggested that high valuations could not be explained purely by enthusiasm for AI. The broader macroeconomic environment also played a role, including financing conditions, liquidity and inflation expectations.
The October 2026 figures reinforce the need to distinguish between valuation measures. Forward earnings multiples have moderated, while longer-term measures remain expensive. It is therefore difficult to conclude that the entire market is experiencing an AI-specific bubble on the basis of stock prices alone.
Are AI Infrastructure Investments Large Enough to Influence Pricing?
Yes. The scale of AI infrastructure investment has increased substantially since the original publication.
In November 2025, estimates of annual investment in data centres and AI infrastructure ranged from roughly $260 billion to $400 billion. Actual spending by the four largest U.S. hyperscalers, Microsoft, Amazon, Alphabet and Meta, subsequently reached approximately $411 billion in 2025.
Their July 2026 corporate guidance indicated combined capital expenditure of approximately $720 billion to $745 billion for 2026, with a midpoint of $732.5 billion. That would represent an increase of approximately 78% over the previous year.
These figures are broader than AI-specific investment, since they also include other infrastructure and business expenditure. The companies also use somewhat different accounting definitions. Nevertheless, the increase is substantial enough to change the economic calculations underlying the AI investment debate.
To put the scale in perspective, the "Big Seven" U.S. technology firms, Apple, Microsoft, Alphabet, Amazon, Meta, NVIDIA and Tesla, collectively generate annual revenue measured in trillions of dollars. Using their combined 2025 revenue of approximately $2.5 trillion as a benchmark, the four hyperscalers' planned 2026 capital expenditure represents roughly 29% of that revenue.
This compares with the original paper's estimate that sector-wide AI infrastructure investment represented 13–20% of Big Seven revenue.
At the firm level, the scale is even more striking. Based on company guidance issued in July 2026 and reported annual revenue for 2025:
| Company | 2026 capital expenditure guidance | Approximate share of 2025 annual revenue |
|---|---|---|
| Microsoft | $175 billion | 62% |
| Amazon | $220 billion | 31% |
| Alphabet | $195–205 billion | 48–51% |
| Meta | $130–145 billion | 65–72% |
The ratios are not directly comparable across companies, and not every dollar of expenditure is directed towards AI. Amazon, for example, also invests in logistics and other business infrastructure. Microsoft's reported capital expenditure includes finance leases, whose accounting treatment changed during 2026.
Even with these qualifications, the figures reveal the extraordinary investment commitments being made by established technology companies.
The question is therefore no longer simply whether AI infrastructure spending is large enough to influence market valuations. It is how much additional revenue these investments must eventually generate to justify their cost.
Are Firms Over-investing?
Given the unprecedented size of current AI capital expenditure, a natural question is whether firms are over-investing.
Established, highly profitable firms almost never invest at this intensity in a new general-purpose technology. AI has features that make future demand difficult to estimate, while rapid technological progress can shorten the useful life of the assets being purchased.
Three arguments help explain why investors reach different conclusions about the sustainability of this spending.
Technology revolutions have always produced apparent bubbles
Historically, technological revolutions naturally induce systematic uncertainty and learning, generating apparent bubbles that can only be recognised after the fact.
AI shows several features consistent with this pattern, including low predictability and rapid diffusion. Companies must make investment decisions before they can know exactly how the technology will develop or how demand will respond.
Even so, established, highly profitable firms have rarely invested such a large proportion of their revenue in a new technology.
Railroads in the 19th century required enormous national investments, but these were not typically undertaken by mature, profitable giants. The 1990s fibre-optic boom provides a closer analogy, although telecommunications incumbents invested a smaller fraction of their revenue.
The scale of today's AI infrastructure investment remains unusual by historical standards, particularly when measured against the revenues of the companies making these commitments.
The break-even maths implies implausible revenue growth
One widely circulated critique is Harris Kupperman's August 2025 back-of-the-envelope calculation.
His original argument began with an estimated $400 billion in AI-related capital expenditure in 2025. Assuming a ten-year average economic life for data-centre assets, this would produce $40 billion in annual depreciation:
$400 billion ÷ 10 years = $40 billion per year.
The ten-year assumption accounts for assets with different useful lives. AI chips, for example, may become obsolete within three to six years because of rapid improvements
in processing performance.
Using the original estimate of $15–20 billion in annual AI-related revenue and assuming a gross margin of 25%, the calculation suggested that annual revenue would need to reach approximately $160 billion to cover $40 billion in depreciation alone.
Generating a satisfactory return on invested capital would require considerably more. Assuming a 20% return on invested capital (ROIC), Kupperman estimated annual revenue of approximately $480 billion.
In July 2026, Kupperman reaffirmed his concerns, arguing that data centres remained deeply negative ROIC investments despite continued spending by major technology companies.
The same approach can be applied to the updated investment figures, although there is an important difference: the approximately $732.5 billion planned by the four hyperscalers for 2026 includes spending beyond AI-specific infrastructure.
Applying Kupperman's assumptions to that amount as an illustrative stress test produces the following calculations:
Annual depreciation
$732.5 billion ÷ 10 years = $73.25 billion.
Annual revenue required to cover depreciation at a 25% gross margin
$73.25 billion ÷ 0.25 = $293 billion.
Illustrative annual revenue required to generate a 20% return on invested capital
480billion×(732.5 billion ÷ $400 billion) = approximately $879 billion.
These calculations are illustrative, not forecasts. They assume the spending is attributable to revenue-generating AI infrastructure and apply a simplified gross-margin model. They also do not account fully for different asset lives, operating costs, or the distinction between infrastructure owners and the companies purchasing their services.
A more recent analysis by Boston Consulting Group (October 2026) provides a useful counterpoint. BCG estimates that constructing one gigawatt of AI data-centre capacity costs approximately $42.1 billion and requires $15 billion in annual revenue to cover operating expenses, depreciation, and the cost of capital.
Applying these ratios to the $732.5 billion in planned 2026 capital expenditure produces an illustrative annual revenue requirement of approximately $261 billion:
$732.5 billion ÷ $42.1 billion × $15 billion = approximately $261 billion.
The two approaches therefore suggest a wide range of illustrative annual revenue requirements, from approximately $261 billion to $879 billion, depending on assumptions about operating margins, asset costs, and required returns.
These figures are not directly comparable because the underlying models differ, and the $732.5 billion spending estimate includes investments beyond AI infrastructure. Still, BCG's lower estimate suggests that Kupperman's assumed 25% gross margin may be too pessimistic, while his 20% required return may be too demanding. Higher margins, however, can also encourage further investment and competition, potentially putting downward pressure on prices.
Even the lower estimate represents a substantial revenue requirement. Although major cloud providers already generate considerably more than $261 billion in annual revenue, that revenue must also support their existing infrastructure and operations. New investments must generate sufficient additional revenue to justify their costs.
Other recent analyses offer further perspectives. David Cahn's July 2026 assessment estimates that the 2026 investment vintage would require approximately $1.5 trillion in lifetime revenue, while Bain & Company's September 2026 analysis estimates that the global AI ecosystem would need $6 trillion in annual revenue by 2031 to support projected infrastructure spending.
These estimates cover different time horizons and parts of the AI industry, so they should not be compared directly. They nevertheless provide additional context for assessing the scale of future revenue requirements.
The central concern remains: AI adoption and revenue growth may be substantial, but new investments must generate enough additional revenue to justify their costs, particularly if competition reduces margins as capacity expands.
Physical constraints may cap the overbuild
On the other side of the debate is the argument that demand for computing power could continue growing for years.
JPMorgan projected approximately $5 trillion in global AI infrastructure spending over five years, arguing that demand for computing capacity remained exceptionally strong.
The bank has also been involved in financing major data-centre developments, including a reported multibillion-dollar financing package associated with Oracle and OpenAI projects.
In addition, physical constraints may naturally limit overbuilding.
Electricity availability, water requirements, data infrastructure, supply-chain bottlenecks and zoning restrictions all influence how quickly new computing facilities can be constructed.
These constraints affect the speed at which companies can translate planned expenditure into operational capacity. Even firms with substantial financial resources cannot necessarily build data centres as quickly as they would like.
This creates an important counterargument to the overinvestment thesis.
If the industry cannot expand capacity quickly enough to satisfy projected demand, infrastructure owners may continue to benefit from limited supply. And even if current investment commitments eventually exceed economically optimal levels, the extent of overbuilding may be restricted simply because constructing additional capacity is physically difficult.
The presence of these constraints does not guarantee that investments will be profitable. It does, however, suggest that the potential for excess capacity should be assessed alongside the practical limitations on expanding supply.
What Conclusions Can We Draw?
AI infrastructure investments are large, speculative and, by historical standards, extraordinary for firms of this size. They carry significant execution risk.
The updated figures strengthen that concern. The four largest hyperscalers' planned capital expenditure has increased substantially, raising the level of revenue and future cash flow required to justify the investment.
Yet the firms undertaking much of this spending remain exceptionally well capitalised, generally well managed and subject to physical and regulatory constraints that may help prevent catastrophic overinvestment.
These considerations support the original distinction between the pricing of AI-related stocks and the investment decisions of AI-related businesses.
It is plausible that technology firms are priced highly despite investor scepticism about their AI capital spending, rather than because the market has fully embraced it.
The evidence through October 2026 does not settle the question of an AI bubble. Semiconductor stocks have experienced a substantial correction while the broader market has remained comparatively resilient. Meanwhile, capital expenditure commitments have increased, and financing arrangements have become more complex.
The original analytical position therefore remains useful, although the greater scale of investment and increased role of borrowing warrant more caution about financial risk.
The strongest conclusion is that expensive stocks and excessive investment are two different possibilities. Each requires its own evidence, and neither automatically proves the other.
Advice for Investors
Regardless of whether valuations reflect AI optimism or broader macroeconomic forces, investors should not rush to take a short position against the technology index or the broader stock market.
Risk assets can be priced richly across many industries, and AI is not necessarily an outlier. The more useful approach is to evaluate companies individually, considering their earnings prospects and the prices investors are being asked to pay.
If you are concerned about a possible bubble bursting, diversify.
The author's Dot-com-era experience provides an illustration. Had the money invested in a single speculative internet stock instead gone into an S&P 500 index fund, the outcome would have been very different. At the time of the original analysis, the authors estimated that such an investment would have gained approximately 400%, representing an annualised return of nearly 7% despite having been made near the worst possible moment.
For even greater diversification, investors can consider broader international exposure, including Chinese and other emerging-market equities.
The experience of 2026 reinforces this argument. Semiconductor stocks entered bear-market territory while the broader S&P 500 remained positive for the year. Investors concentrated in a narrow group of AI-related companies faced a very different outcome from those holding more diversified portfolios.
This does not eliminate investment risk, but it reduces dependence on correctly identifying the winners of a technological expansion or predicting when a particular sector might decline.
Advice for Policymakers
The AI infrastructure boom was initially financed largely through equity and the cash flows of highly profitable technology companies, helping to limit systemic financial risk.
Equity-financed technology booms can contribute positively to long-term innovation, even if stock valuations eventually correct. Investment can create productive infrastructure and technological capabilities that retain economic value long after an initial period of optimism has passed.
However, the financing picture has become more complicated.
The original analysis warned that, if JPMorgan's infrastructure investment projections proved correct, a significant wave of debt-financed investment, potentially around $1.5 trillion, could follow.
Developments in 2026 have made that concern more immediate. The Financial Times reported in October 2026 that AI-related corporate debt issuance had reached approximately $466 billion during the year, compared with $101 billion in 2025. Increased demand for credit-default protection also indicated growing investor concern about financial exposure to AI infrastructure.
In addition, S&P Global warned in October 2026 that some major technology companies may have greater AI-related debt exposure than publicly reported figures suggest, particularly through interconnected financing arrangements.
These developments do not establish that AI investment poses a systemic threat. They do, however, suggest that the largely equity-financed nature of the boom can no longer be treated as a sufficient safeguard on its own.
For policymakers, the distinction between equity-financed innovation and debt-financed infrastructure expansion is therefore increasingly important.
The appropriate response is careful monitoring of credit exposures and financial interdependencies, particularly where loans or financing structures depend on optimistic assumptions about future demand for computing power.
If AI infrastructure investment continues to increase, understanding who ultimately bears the financial risk will be as important as understanding the benefits the technology may bring.
Author attribution
Mattia Landoni is Associate Professor of Finance at CEIBS. Renxuan Wang is Assistant Professor of Finance and Director of the CEIBS-APS Centre for Financial Markets at CEIBS.
Frequently Asked Questions
What would actually tell us this is a bubble?
Three indicators are particularly relevant: stock prices implying long-term dividend growth comparable to historical bubble extremes, capital expenditure requiring implausible future revenue growth to generate an adequate return, and a substantial increase in debt-financed investment. Taken together, these would provide stronger evidence of a bubble than high technology stock prices alone.
How is this different from the dot-com bubble?
Many leading companies financing AI infrastructure today are established, profitable businesses with substantial financial resources. The expansion also began with considerable equity and internal cash-flow financing, while physical constraints restrict how quickly new capacity can be built. These differences may reduce the risk of a widespread collapse, although they do not prevent overinvestment or sharp stock market corrections.